

- John Moore
- Executive Director
- Engaging in STEM Education with Big Data Analytics and Technologies: A Rowan-Cove Initiative
- Palmyra Cove, Institute for Earth Observations, Rowan University
- Peter Dorofy
- https://www.linkedin.com/in/peter-dorofy-b0465554/
- Director of Science and Technology
- Engaging in STEM Education with Big Data Analytics and Technologies: A Rowan-Cove Initiative
- Palmyra Cove, Institute for Earth Observations
Engaging in STEM Education with Big Data Analytics and Technologies: A Rowan-...
NSF Awards: 1610911
"Engaging in STEM Education with Big Data Analytics and Technologies: A Rowan-Cove Initiative” focuses on the large amounts of data have become available across fields in science, industry, government. Big data analytics and technologies hold tremendous promise to boost economic productivity, enhance national security and improve the quality of life.
ACQUIRE: Acquiring satellite imagery and data sets are often difficult for teachers, students, and citizen scientists. HoloGLOBE was envisioned to be a “mixed reality” node where participants post and share their interpretations of satellite imagery along with their own field observations with other participants worldwide. Through Augmented Reality current satellite imagery and data sets can be viewed and investigated.
ANAYLZE: Traditional field experiences of making observations and measurements following established science protocols are used to create a database, which provides "ground-truth" data that can be compared to data/imagery gathered from space platforms as in the GLOBE Program’s Satellite Collaborations. The use of ImageJ and the creation of Geographic Information Systems (GIS) allowed for data to be viewed in a new way, and once again, developed transferable workforce readiness skills.
APPLY: STEM professionals are using satellite and remote sensing technologies to incorporate imagery, data, real-time observations, and modeling into daily decision making on a local to a global basis. GIS content is taught as a technical skill, and is used to develop "Geospatial Thinking" and the gathering of "Environmental Intelligence" to be used in problem-solving in multiple communities, and has become an integral component of data analysis and communication.
-
 Mapping the Invisible: Practicing STEM Literacy
Betsy Stefany
-
 Integrating Computational Thinking in Elementary Science
Kevin Waterman
-
 Utilizing Additive Manufacturing Technology to Create Next-G
Eric Wooldridge
-
 Quantitative Approaches Boot Camp
Victoria Prince
-
 CS4GA- Featuring South Atlanta Cluster LONG MS School
Chuck Barlow Jr
-
 Agricultural Applications of Computer Science
Joseph Kern
3176 Views
Continue the discussion of this presentation on the Multiplex. Go to Multiplex
3176 Views
presentation
has been viewed
Related videos you might be interested in...
-
Mapping the Invisible: Practicing STEM Literacy
Betsy Stefany
-
Integrating Computational Thinking in Elementary Science
Kevin Waterman
-
Utilizing Additive Manufacturing Technology to Create Next-G
Eric Wooldridge
-
Quantitative Approaches Boot Camp
Victoria Prince
-
CS4GA- Featuring South Atlanta Cluster LONG MS School
Chuck Barlow Jr
-
Agricultural Applications of Computer Science
Joseph Kern
William Spitzer
Vice President
The "acquire, analyze, apply" framework used by the project is a nice clear way to explain what students are doing, and the mix of methods (kites, virtual reality, satellite data, etc.) is really interesting.
I was wondering about what kind of data you are collecting related to learning impacts, and what you might be learning about the strengths and weaknesses of the different project methods/components in terms of advancing learning and skill development.
Thanks,
Billy
John Moore
Executive Director
We are looking at their ACTIVE engagement with the various components. Through having students/teachers working in teams, we have created diverse working groups. For example, there are students who gravitate towards field work, others towards the technical aspects (i.e. preparing and flying the kites and/or drones,VR/AR) and others in tasks like image analysis using ImageJ and.or Multi-Spec. In terms of CTE applications, all of these experiences are in some way transferable into other disciplines that students may encounter in their future studies or careers. Working in an Informal education setting we are not restricted to standards, testing, curriculum demands etc., rather we are focused on exposing students to the work of STEM professions found throughout NSF, NASA, and NOAA. "To Observe the Earth and Visual their Future"! We encourage and support ALL students to participate in the GLOBE Program's Students Research Symposiums and/ or the International Virtual Science Symposium.
Betsy Stefany
William Spitzer
Vice President
Thanks John, I appreciate hearing more of the details!
John Moore
Executive Director
The AREN Project is another NASA CAN Project that has their own set of learning objectives and goals. We are honored to partner with them and leverage our work since we share so many common goals. You can check out the NASA AREN Project at https://www.globe.gov/web/aren-project. Through these type of partnerships/collaborations, we grow our network of PI's, scientists, and educators. STUDENTS are the primary beneficiaries of these collaborations!
Betsy Stefany
We are also part of the User Group of the AREN Project, equally honored to be part of that community. The video mentions the ground truthing aspect. Could you add more about the venture out to the field with the Aeropods and the types of levels of expertise that you build in the process of "active engagement"? If you visit our video, we are converting the classroom experience to the role models and would like to hear more about your approach.
John Moore
Executive Director
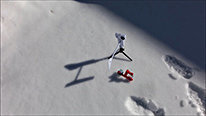
Betsy, thanks for comments and questions. As a member of the AREN Community, I am sure you have experienced the first challenge ... building the kites and assembling the Aeropod. Learning to fly was the next challenge. We had 2 college interns work with us to accomplish these first 2 steps. We were then "field ready". We worked with a group of teachers out in the field teaching them to fly and collect imagery. We had previously flown drones capturing imagery and through a software called "Drone Deploy", we were able to create a 3-D map and also produce thermal scenes. The imagery from the AEROKATS were put into a GIS (that can be seen in the video). This part was implemented to address the "ACQUIRE" portion of the project and the creation of a GIS , Analyze. We then had teachers fly drones to collect imagery of their school, and introduced Kites 101 to the students. It is important to note that we do not expect all teachers and students to achieve very high skill proficiencies, but rather allow students to gravitate to the portion that they feel most interesting, becoming the lead for that "job". In conclusion, students come to understand that it takes a team which varying levels of expertise to produce an image.
Elysa Corin
Senior Researcher
In addition to being able to explore data acquired by satellites, it was really interesting to see students collecting their own data via the kites. Could you tell us a little more about what students are doing with the data they collect? Are you finding that collecting their own data instead of/in addition to using the large data sets is an important element to this project? Thanks!
John Moore
Executive Director
We do believe that students collecting their own data is essential. I think this a necessary first step on the journey of Data Literacy. Precollege students are asked to make data driven assessments, or decisions, but having little or no understanding of the data collection process (the protocols, frequency of sampling, and quality control). The data collected is being used to compare data sets from ground observations and any variance in altitude fro example. In a case presented in the video, students created a map through the use of GIS, of the study area. Creating a GIS is year another CTE transferable skill.
John Moore
Executive Director
Greetings! After engaging in discussions around the concept of “Big Data” and how to expose the next generation of STEM professionals (K-12 students) , we concluded after years of observing students in both formal and informal learning environments, that the Geosciences present a unique venue to not only introduce students, but engage them as well. Thus, the concept was broken down into three core areas of learning … Acquire, Analyze, and Apply. Students are able to engage in investigations and/or research that includes years of historic data, imagery, and more recently, visualizations. Teachers, students, and citizens are exposed to Geoscience related incidents every evening in the news, for example, hurricanes, tornadoes, flooding, wild fires, earthquakes, tsunamis, snow and blizzards, to name a few. This project allows students to participate in one, or all three aspects i.e. how to acquire, how to analyze, and how to apply their findings which can take the form of and investigation, or application to an issue.
The question is for the K-12 community, where in the curriculum do teachers and students have the opportunity to embrace these events? Looking at STEM through the eyes of the Geosciences there is a strong case to be made for making the bold statement that Earth SySTEM is the perfect correlation of the “S”, “T”, “E”, and “M” that perhaps may not be replicated by any discipline other than the Medical Sciences. The “S” in Geosciences is by its very nature interdisciplinary. The “T”, there are earth observing satellites, remote sensors, ships, aircraft, and balloons. The “E” required to design and build these instruments speaks for itself, and of course the “M” supports all of the engineering, and plays a critical role in analyzing the data. We hope that our video demonstrates some of the ways that teachers and students can participate in authentic research while learning valuable workplace readiness skills.
We look forward to your questions, comments and discussions.
Margaret Glass
Independent consultant
Thanks for sharing your video about Earth SySTEM. I love the integration of different data sets and technologies as well as the potential for increasing data literacy for students in multiple ways. I have been wondering about the question you pose in your last post: “where in the curriculum do teachers and students have the opportunity to embrace these events?” Do you offer teacher/educator only workshops? Might that be one way to build momentum about making space in the curriculum?
Interested to hear more!
Margaret
John Moore
Executive Director
Thanks for you comments! Yes, we have conducted Teacher Professional Development Workshops in an attempt to accomplish exactly what you have pointed out ... developing content, skills, and educational leadership, building a K-12 Teacher Think Tank that is supported by each of us in the group. There are 2 national education policies that present opportunities for change, the inclusion of the Earth and Space Sciences in The Next Generation Science Standards (which require most of this type of content), and STEM of course. In my view, STEM course designers have the opportunity to develop and address strong STEM goals, solve the underrepresented Geoscience dilemma in K12 education, offer students workplace readiness skills, AND study relevant environmental topics that are a part of our nations future. The bonus is ... students actually like this stuff!
Margaret Glass
Margaret Glass
Independent consultant
Thanks for the clarification, John. I see from the teacher comments here that your PD workshops are especially appreciated! I like how you are leveraging all the different potential ways to engage kids and educators in this content domain!
Margaret
Vicky Gorman
I have the distinct pleasure of living close to the Institute for Earth Observations (Palmyra Cove, NJ) and have taken many professional development classes with John Moore and Peter Dorofy. By using the SEES model, satellite imagery and remote sensing and encouraging my students to collect their own data using the GLOBE program protocols, even the most "science-phobic" student can get excited about phenomena around us. John and Pete are not just talking heads. Their approach to teaching and learning with big data really works!!!
John Moore
Executive Director
Vicky, thanks for your comments. To all, Vicky is an amazing teacher and strong educational policy leader. We are proud that she is on our team! I would invite anyone to contact her and take a look of how she has collaborated with us, add her personal touch for the concepts and activities to work in her particular teaching environment, and worked through the implementation in her classroom. One only has to speak to, or hear from, her students about engaging in their research and you will have all the proof you would ever require that students can excel using these approaches. Vicky and her students are often featured on GLOBE and GLOBE Mission Earth webinars, check out the online archived events and see for yourself!
Thanks again for your post, I'm looking for other "Agents of Change" out there to comment!
Mike Jabot
What an INCREDIBLE contribution to how we can help students (big & small) discover the world around them!!!
Peter Dorofy
Director of Science and Technology
Thanks Mike for the kind words. We use the innovation lab at our center in particular to prototype new apps in mixed reality and its use in visualizing the world around us. From manipulating 3d molecules to walking on the moon, students use mixed reality to explore the big and the small!
John Moore
Executive Director
Mike, thanks for your kind words. There continues to be discussion around the topic of "creating the pipeline". One of our goals for this work is to expose K-12 students, and sometimes that includes teachers as well, to the world of the outdoor laboratory, current technology, and how all of these areas of study are required to address issues like, water quality, land cover, environmental health, agriculture/food, hazardous weather, and climate. These are not issues that can wait for graduate school. Our approach has been to give teachers the right tools and resources, create "pockets of excellence" while expanding our work through groups like GLOBE, NASA, NOAA, American Meteorological Society, AGU and others. A part of this change is in curriculum, instruction, and assessment departments, the focus then shifts to teacher preparation. Often these types of topics are deemed "too difficult" for precollege students. That is false! We have Pre-K children engaged in GLOBE Phenology investigations (i.e. Green-up and Green Down, Budburst) and have third graders able to work with concepts such as "ascending and descending" polar orbiting satellites and why there is a choice between geostationary and polar orbiting satellites to complete the science mission.
Thanks for checking in!
Tim Spuck
John, you continue to do great work! Love the NASA kite idea and that various way you are getting Earth data into the hands of students. Also the acquire, analyze, apply framework is a simple and elegant way of thinking about what you're doing and why. I'm currently PI on a project called IDATA exploring computational thinking in astronomy and developing software that makes astronomy accessible to the blind and visually impaired. We have thought a bit about how these resources can be used in geosciences, so we should talk sometime. You can see our video at https://stemforall2019.videohall.com/presentati... .
John Moore
Executive Director
Tim, thanks for leaving a comment. It is always good to hear from you and the exciting projects you continually are involved with. Here at the Institute for Earth Observations we have, in the past, discussed the implications of the blind and visually impaired. As you know, the nature of our work is also very visually oriented, we would have a lot to learn from your findings. Our work in all three areas of A3 have significant visual components., e.g. flying kites as you mentioned, determining differences is spectral bands, change over time, creating GIS maps etc. We are in the process of expanding our programing to include Astronomy, so this might offer us an opportunity to work together again and field test some of your discoveries associated with your project. Your expertise would prove to be invaluable I am sure.
Further posting is closed as the showcase has ended.