


- Andee Rubin
- https://www.terc.edu/display/Staff/Andee+Rubin
- Senior Scientist
- ESSIL
- TERC
- Leilah Lyons
- https://www.cs.uic.edu/~llyons/
- Director of Digital Learning Research; Assoc. Professor
- ESSIL
- New York Hall of Science, University of Illinois at Chicago
- Ada Ren
- Research & Development Specialist
- ESSIL
- TERC
Public Discussion
Continue the discussion of this presentation on the Multiplex. Go to Multiplex
Andee Rubin
Senior Scientist
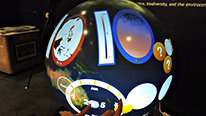
Making the complex interactions of ecological systems understandable is a critical educational challenge for today - and the future. The Connected Worlds exhibit at the New York Hall of Science provides a fertile - and fun - testbed for helping young people make sense of these complicated sequences of cause and effect. But a visit to Connected Worlds is also complicated and visitors need some help untangling and reflecting on what they experienced. Watch our video to see how we used data science and visualization to help students dig deeper into ecology and systems thinking. We think our approach to using log file data to help those who generated the logs reflect on their experience might be useful for other systems - let us know if you think you have an application for our technique.
christine Matis
I find the log file data to be an excellent means to engage students and see how their actions can impact on outcomes. This provides a mechanism for students to not only reflect but take responsibility in decisions ones make. it is a great learning tool...
This is one of the best exhibits I saw for student learning. Great job.
Andee Rubin
Senior Scientist
Thanks for your comment, Christine. We are lucky to have the log data as a tangible trace of what students did, since it's a lot for them to take in when they are actually in the museum. Interestingly, the log data in this case only records the results of what they did - NOT their actions - so it's been quite a process to figure out how to help the students recognize where they had an impact on the state of the system. I think students would greatly benefit from a return trip to Connected Worlds after they have had a chance to reflect so that they could take more "informed responsibility" for their decisions.
Sally Crissman
Senior Science Educator
Hi Andee
I immediately wanted to freeze the video to look more carefully and the rich detail in each frame of the Connected Worlds interactive immersive simulation! There's so much there and the kids were moving very fast. I find your strategy for slowing them down to think and reflect most interesting. Your success focusing students attention (using the real world water diverters that they can themselves place) using actual diverters and visualizations is interesting. Stopping to tell the story represented in graphs is another learning strategy that we've found effective in the classroom.
What kind of evidence indicates that a student is using systems thinking?
Sally
Andee Rubin
Senior Scientist
Hi Sally -
As Ada said, some of the video is sped up - but even so, there is a LOT going on in Connected Worlds and even after visiting it a bunch of times, I have trouble knowing where to focus - so I can imagine it's even more difficult for kids who just get half an hour.
Ada gave a good summary of what we've seen as evidence of systems thinking - but I have to admit that we've only had this one experience so far. In a larger study, we'd want to ask students to do something more controlled, like drawing a concept map of the system or perhaps responding to a scenario we'd present. I would say that most of the students understood that the amount of water each biome had depended on how much each of the other ones had. One girl told me, though, that even if they had agreed to split the water equally among the four biomes, it would be difficult to achieve because of the way the logs and the water interacted, so she understood both the desirability of that situation and its difficulty.
Ada Ren
Research & Development Specialist
Hi Sally
Some parts of the video is sped up!
For your systems thinking question, in the classroom, students were able to recognize what they did in the Connected Worlds environment, especially their experience of redirecting water flow, and recognize how their actions affected not just their own habitat but those of other groups. Individual students considered not just their own actions and goals but the goals of their group as they navigated the data visualization and recalled their experience from the previous day. They recognized the difficulty of maintaining the health of all habitats simultaneously.
Ada
Alan Peterfreund
Andee:
This is a fascinating approach. Will you be able to replicate the use in other locations or is it dependent on specific capabilities that were developed at the New York Hall of Science?
Leilah Lyons
Director of Digital Learning Research; Assoc. Professor
Hi Alan,
Our intervention is particularly valuable for the type of content area (complex systems are especially challenging for learners, owing to how many elements need to be attended to) and the type of simulation (a participatory simulation, wherein learners are co-constructing how the simulated scenario evolves). Its is possible to enact a participatory simulation with minimal technology, however - people like Elliot Soloway and Vanessa Collela were doing it with palm pilots back in the 90s. The innovation of this work lies in capturing records of how learners engaged with a simulation, and re-presenting the experience to them in a way that supports their development of a wider awareness of the simulation elements and the causal relationships between those elements. So in principle we could adapt our approach to other participatory simulations, although the specific nature of the visualizations might change.
Alan Peterfreund
Thanks Leilah:
Having spent time looking at innovations that were further developed as part of I-Corps L, I-Corps I see a lot of potential here for scaling the innovation based on the core principles and the basic embedded technology
Leilah Lyons
Director of Digital Learning Research; Assoc. Professor
That's kind of you to say! We've looked at a lot of ways to extend our work, but I hadn't thought of I-Corps.
DeLene Hoffner
Lead Teacher
What an exciting and engaging participatory simulation! How do you involve teachers? The video mentions "back in the classroom", I wondered if that is teacher lead or New York Hall of Science staff lead. Being a teacher, I wondered what my role would be in your 3 day process.
Leilah Lyons
Director of Digital Learning Research; Assoc. Professor
Hello DeLene,
For our first trials, Andee stepped into the teacher role. We didn't want to throw a teacher into the session cold, and right now we're building out the experience, so we haven't yet spent as much time on the professional development side. That said, we would eventually want to have the teachers take on a more integral role. We've started by creating pre-visit materials for teachers (Ada worked extensively on that), and the next step would be to create a post-visit guide to help teachers use the visualization with the students (I'm sure Andee could say more about how we might structure that - I'm the museum person on the grant and so don't claim to be a teacher PD expert). If you had any thoughts about what we might need to do to better support teachers, we'd love to hear your ideas!
Andee Rubin
Senior Scientist
Hi DeLene -
To add to Leilah's comments about the teacher's role:
Eventually, we would hope both to provide a post-visit guide that would include general instructions for a teacher in how to use our visualization - but our data science algorithm that identifies distinct patterns of water flow would also allow us to point out to the teacher where particularly interesting parts of the simulation occurred, so that she could focus class discussion on those. For example, we might highlight for the teacher a period of time when one biome was getting all the water - and she could then ask students to talk about what was going on during that period. We're hoping to explore this a bit in the remaining time of our project.
Acacia McKenna
Director, Science Education Competitions
The use of visualization to understand complex systems is very compelling! This also enhances learning in collective findings and collaboration in the classroom. Do you anticipate that this could be broadened to a larger scale? What type of learning impact is envisioned at the teacher level? Is there a learning dashboard that the teacher has access to or is the teacher more in a facilitator role while the students are engaging in the process?
Leilah Lyons
Director of Digital Learning Research; Assoc. Professor
Hello Acacia,
While we're not currently working on scaling up, there is potential (see the communication with Alan above). Learning impact at the teacher level - well, I'm the informal learning researcher on the team, so I might not be best positioned to comment on this, but one thing I think we all noticed was that for both the students and the teacher, looking at the data *you* generated was a powerful way to open the door to data interpretation using visualizations. One teacher remarked that the same students who were so fluidly telling stories using our data visualizations were the same group who had been struggling with line graphs in math class. So I'd suspect that teachers might have to recalibrate what they expect their students to be able to do.
We don't have a dashboard - our visualization is structured as a multi-purpose tool, not a guided inquiry experience (like WISE or Progress Portfolio), so it's not clear (to me) what kind of actionable information a dashboard could give the teacher. (We can't show, for example, what percentage of students have finished a task, because the tasks are external to the software). As you suggest, we envision the teacher playing the role of a facilitator. For our classroom trial, we gave the students a worksheet with a few questions to answer using the visualization. Then Andee walked around the room answering questions and giving assistance when needed.
I see that you listed your role as "facilitator" - we'd love to hear any ideas you might have about how we could make the experience more amenable to facilitation!
Acacia McKenna
Director, Science Education Competitions
Engaging discussion and collaboration is key for educational success. I appreciate how your platform embraces just that. As you fine tune your tool, I will be interested in understanding the role of the teacher as a facilitator of discussion and thinking. In particular, using science inquiry to drive reflection on science and engineering practices in the real world. Very exciting!
Jim Hammerman
I've played with Connected Worlds – it's lots of fun – but I hadn't played long enough to figure out some of the more complex elements of the ecosystem. Do you find groups that have an introduction to the possible affordances and natural history behave differently than those who just jump in? Are there different group behaviors when people actually take on the different roles – planters, waterers, guiders, etc.?
Also, it sounds like the different data visualizations you created are accessible to students in retelling the story of their experience and understanding some things about the ecosystem. That's great! I wonder if you can say more about the research that you've done about these representations, how you've modified them to make them more accessible, and other kinds of data visualizations that you're exploring to help students understand other kinds of relationships in the environment?
Katie Stofer
Leilah Lyons
Director of Digital Learning Research; Assoc. Professor
Hi Jim!
Great questions, a lot to unpack here.
Re. the effect of introductions: NYSCI has experimented with a number of ways to introduce learners to CW, too many variations to detail here. We have the ability to create CW sessions with built-in pauses (i.e., reflection periods), and to "chunk out" the session into different episodes, so we can do a lot of creative things with how we stage the experience. We've created flood and drought scenarios, and for a while had a fantasy story wrap-around that positioned visitors as an "away team" to an alien planet, tasked with collecting information on the flora and fauna. One basic strategy we find effective is to let visitors play with abundant system water so they can get acquainted with the natural environments, pause, and then ratchet back the water present in the system to give them more of a challenge to think systemically.
We find it's hard to give visitors a lot of instructions on-site, because they are itching to get into the simulation - even if we tell them, they're too busy looking to listen. So for this work, we created pre-visit materials to help acquaint the students with the kinds of plants and animals present in each biome.
WRT group behaviors - we see a lot of great variations. We've experimented with giving visitors roles (indeed, that's what we did here), but visitors often self-assign. One thing that doesn't work very well, though, is a total free-for-all. Splitting visitors into biome "teams," even if we don't give them more specific roles, seems to introduce just enough tribalism that they then can self-organize. I've seen school groups spontaneously create representative democracies (nominating a person from each biome group to negotiate water distribution, for example), and even give each other more abstract, less action-oriented roles (e.g., "watchers" who just monitor for changes). One thing we say at NYSCI is that CW is just as much about giving learners practice with collaboration as it is about giving them practice with complex systems.
WRT visualizations - in a parallel grant we've begun to more systematically explore the design factors involved in making accessible CW visualizations. For this grant, we've just completed and tested our first implementation, and got something of a ceiling effect - the kids did NOT struggle with making sense of the visualizations, or linking between the visualizations, which we didn't expect. We really thought we'd expose issues with the visualization that needed correction! So now we're thinking more integratively, about how the visualization design and classroom activity can be designed to be more complementary.
Liz Bradley
This is a fun and effective way to bring people into meaningful contact with the fundamental ideas of complex systems science. Nicely done!
Andee Rubin
Senior Scientist
Thanks, Liz! I know you have in-depth knowledge of complex systems as a scientist, so your comment means a lot.
Leilah Lyons
Director of Digital Learning Research; Assoc. Professor
Thanks, Liz!
Katie Stofer
Interesting! Looks like a fun experience. I'm wondering what you know about impacts on more "public" audiences - i.e. your general adult/family visitors. How could you use the visualizations to help them make sense of the experience, especially in such a short time frame as they would likely be interacting (certainly not over 3 days ...)?
Andee Rubin
Senior Scientist
Thanks for your comment, Katie. You are totally right that it's a much more challenging task to work with the public who are just wandering in to Connected Worlds as part of a day at the museum. That's why we started with a more controlled situation in which we actually had a more time with visitors - although it was just two class periods bracketing their half-hour in the museum. Leilah's been working on a way to visualize some of the data DURING visitors' time in the space and providing the visualizations to the interpreter stationed in Connected Worlds, so I'll let her add more details about that project.
Frank Davis
Hi Andee,
So much to think about in this simulation of an ecological system. My first thoughts were about the complexity of the “system” for fifth graders -the interlinked system of various causes to various effects. I also wondered about how the physical embodied work of diverting the water helped them to think about the change in the availability of water in various habitats. Great project – next time I’m in NY would love to check it out.
Ada Ren
Research & Development Specialist
Hi Frank, thank you for your interest! We first introduce the students to how plants and animals are linked in each habitat in the pre-visit materials. Their experience in the Connected Worlds environment reveals more of the intricacies of the whole system, namely, the challenges of diverting water, and the difficulty of maintaining a healthy overall system with limited resources. Their experiences, both agentive and observed, are recorded in the data logs and the abstracted video of the space that shows the water flow. These support their recall of their session and help them to step back and see the bigger picture, what everyone else was doing, and how their actions affected the rest.
Connected Worlds is available to the public, but our materials and data visualizations are currently available for each class visit session we facilitate.
DeLene Hoffner
Lead Teacher
What have you learned the "hard way" that you may want to share with others who may be setting up their own project? We all learn by doing and can improve the next time. What would you do differently the next time?
Andee Rubin
Senior Scientist
Thanks for this "hard question," DeLene! Much of what we learned was about the difficulty of working with log files - so here is some advice for other people who are interested in log files from an already-established simulation as a source of data about users' experiences and, potentially, learning. Developers set up log files for their own purposes - and these are not necessarily the same as learning scientists' purposes. So, for example, the log files for Connected Worlds only have the state of the system recorded, as they were built to support the projected display. We were interested in users' actions, but had no way to access them directly - rather, we had to either infer them ourselves or ask the students to remember them when they viewed the effects in the recap. We were a bit naive going in to this project about how much time it would take to get logs that worked for us - we actually spent much of the first year working with the developers to expand and tailor the logs for our use.
Further posting is closed as the showcase has ended.