


- Katie Stofer
- Touch Interaction for Data Engagement with Science on Spheres (was Think Globally, Interact Locally)
- https://uftidess.wordpress.com/
- University of Florida
- Schuyler Gleaves
- Touch Interaction for Data Engagement with Science on Spheres (was Think Globally, Interact Locally)
- https://uftidess.wordpress.com/
- University of Florida
- Carrie Schuman
- https://themeanderingscientist.com
- Postdoctoral Researcher
- Touch Interaction for Data Engagement with Science on Spheres (was Think Globally, Interact Locally)
- https://uftidess.wordpress.com/
- University of Florida
- Nikita Soni
- PhD Student
- Touch Interaction for Data Engagement with Science on Spheres (was Think Globally, Interact Locally)
- https://uftidess.wordpress.com/
- University of Florida
Public Discussion
Continue the discussion of this presentation on the Multiplex. Go to Multiplex
Laura Guertin
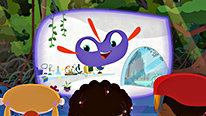
I really enjoyed viewing this video and learning about your project (especially the "Pufferfish" exhibit). I'm curious about the impact of the interaction on not just the science learned but what is retained after the interaction. You mention that different ages interact with the sphere different ways, with kids willing to do more exploration. Is there a way to measure the learning of science through the interactive sphere (which I know is very hard to accomplish with a one-time exhibit interaction). Thanks for any additional information you can provide.
Katie Stofer
Research Assistant Professor
Hi Laura - that is what we are working on. Using our video data from a couple of the studies in the project, we are looking at what the participants say, both in response to prompts from project team members in lab studies, and in response to prompts on the exhibit in museum studies. Our analysis so far shows people talk about the content and they demonstrate use of science practices/concepts such as describing patterns and asking questions. We presented some of this work at NARST 2018 and have one paper under review - I can share more details privately if you are interested.
Elysa Corin
Senior Researcher
Great video, it was really interesting to see the ways in which users are interacting with the visualizations. I can imagine there are many benefits to presenting science data via the science sphere. How you are envisioning impact on the user in this project, and how are you measuring it? Have any unexpected challenges arisen when measuring impact on the users? Thanks!
Brooks Mitchell
Katie Stofer
Research Assistant Professor
Hi Elysa - there are hopefully multiple impacts: exposure to global satellite data as a thing for people who may not know about it (general awareness), and understanding how scientists get data on climate change and its related concepts; practice with interpreting real data using real science practices and content (describing patterns, comparisons, asking questions); and understanding of how actual concepts like El Nino are described by scientists.
We are primarily looking at the participants' conversations at this point to measure these impacts, but hoping to match it with their touch data, which we capture through the sphere technology, and see if we can see changes in those interactions based on whether they are exploring patterns, or making inferences, etc. As I mentioned to Laura, we are definitely seeing initial evidence of use of concepts and practices. Hopefully more to come!
Elysa Corin
William Spitzer
Vice President
It was great to see a more intuitive interface for interacting with global visualizations, and I appreciated the attention that this project is paying to effective user interface design and testing. People do always seem to want to touch these spherical displays, and it is great to see that put to use!
I wanted to learn more about how this work is building on prior research on effective use of spherical displays to promote understanding. For example, is this project addressing the role of staff facilitation, or is it focused primarily on unfacilitated use? What are some of the specific learning goals or "meaning making" behaviors that you are investigating? And, what kinds of evidence are you looking for?
Thanks,
Billy
Brooks Mitchell
Katie Stofer
Research Assistant Professor
Hi Billy, I've been working with non-touch "personal" size spheres (18" diameter with parallel touch screen for content control), with and without live facilitation and Science on a Sphere since around 2005. So this builds on a lot of work by Haley Goldman, et al, plus our work at Hatfield Marine Science Center, and my dissertation, among others!
In this research, we are going for non-facilitated experiences. As we mentioned, we are looking at evidence through conversation of people mentioning particular content related to the data patterns and values, comparisons over space and time, and evidence of people using science practices such as asking questions or discussing evidence.
Happy to share more if you have more particular questions! Thanks for your questions.
William Spitzer
Vice President
Thanks Katie for the additional context, this is really helpful. We were involved a few years ago in developing research-based interpretation for data visualizations using a variety of platforms, if you are interested take a look a www.vischange.org. I look forward to hearing more about the research, and hope you will post the results to www.informalscience.org!
Katie Stofer
Research Assistant Professor
Definitely will be posting to informalscience.org. And yes, I'm aware of the Vischange.org stuff - been trying to get ahold of those from another team member from the project who was the contact in the article I first saw. Yeah, ultimately I think the sphere we have would benefit from facilitation of course, but we know how expensive and tricky good facilitation can be!
Thanks!
Carrie Schuman
Postdoctoral Researcher
Hi all, I am a post-doctoral researcher currently on the team. I wanted to be sure to share our website (https://uftidess.wordpress.com/) which has a collection of posts that describe our progress both from the education and human computer interaction side and from the perspective of multiple team members! There is also some additional information about the project.
Katie Stofer
Research Assistant Professor
Welcome everyone! Maybe to address some of the comments/questions we've been getting, I can clarify that this research is barely beginning with the touch-enabled sphere at this point. We have had a single NSF AISL grant and have actually spent a good deal of time on prototyping and designing the interactive experience based on all sorts of prior work that Billy alluded to, as well as designing the actual natural interactions that people want to use in this space.
Due to the relatively long timeframe for publishing education research, we have more published work in the Human-Computer-Interaction literature. Check out our project website https://uftidess.wordpress.com/ for links to those papers.
Thanks for your questions and discussion!
Brooks Mitchell
Great video! It is quite interesting to hear about the ways that different generations approach the touch screen experience.
I think the Earth visualizations are great; this is a great tool to help patrons visualize data and understand our Earth's multiple dynamic systems. Have you all considered using imagery from other objects in the solar system? I could see this as being a great tool for helping patrons understand Lunar and Martian surface geology!
Katie Stofer
Research Assistant Professor
Hi Brooks, thanks for your comments. As for the content, definitely - we would love to expand the content. Science on a Sphere, in particular covers a lot of the solar system - I have some questions about data resolution that I think would be great Earth/other body comparisons as well (like Landsat vs Lunar or Martian imagery ...). We would also love to get these touch-enabled spheres into libraries, etc. Maybe we should talk about a partnership!
Margaret Glass
Independent consultant
I am curious about when and how you plan to use other data sets to understand how users interact with data visualizations. The work in the video example shows ocean science data, and you mention solar system data in a previous post. What are the next content domains you want to explore? Do you expect that the kinds of interactions – how people manipulate and try to make sense of the data – will vary with the kinds of data?
Looking forward to learning more!
Margaret
Katie Stofer
Research Assistant Professor
Hi Margaret, unfortunately, our grant is over, and we only leased the sphere, so at this point ... we don't have further immediate plans to do any new content. Your question about different interactions based on different content is a really interesting one, and I'd like to defer to our HCI grad student, Nikita, to give an answer from that perspective.
However, I think different types of data could produce different interactions - spatial on Earth and solar system could be similar, but then again, due to the resolution of the data and maybe even when looking at say, the sun in different wavelengths and therefore seeing different features such as solar flares and sunspots, participants may interact differently. There's also a significant difference in scale between the Earth and the Sun, though less so between the Earth and Moon or Mars, that could play a role. Lots of questions, for sure. I would be very interested in your thoughts on the matter, as I've mostly worked with Earth science data to date (besides presenting some of the rest of the solar system in a live show that is more of a tour of many bodies instead of digging in to one).
Margaret Glass
Independent consultant
Hi Katie,
Thanks for your response - and thanks for the input in this forum from the whole team. I appreciate all the new questions that have come out of your research to date and look forward to following the summative reports!
Margaret
Nikita Soni
PhD Student
Hi Margaret, Thanks for your comment.
I am Nikita, a HCI grad student on the TIDESS project. Until now most of our research has been revolving around understanding what types of touchscreen gestures people do to make sense of science data visualizations on the large touchscreen interfaces. I agree with Katie that it will be interesting for further work to explore children's and adults' interactions patterns and conceptual models while interacting with different learning content on the sphere and design interactive learning environments that support such interactions.
Further posting is closed as the showcase has ended.