16-706-40000
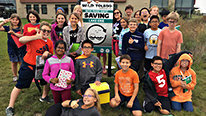
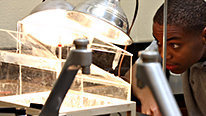
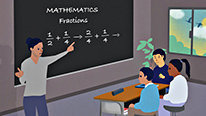
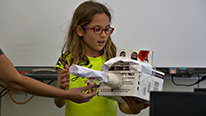
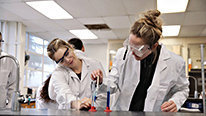
Nevada Mathematics Project was a statewide initiative aimed at increasing teacher content and pedagogical content knowledge of the Common Core Standards. An innovative approach of STEM integration approach was used in the third year of the project. A design research approach was used to design and deliver professional development. The Context of science was used to support teacher learning of the Common Core standards. We also integrated research on gestures from the learning sciences — the project involved supporting the entire school system in Nevada. We impacted over 12, 600 students. A statewide mathematics education partnership evolved. We partnered with six institutes of higher education. Our long-term goal is to transform Nevada and learn from that process. We designed studies to investigate the following topics: Institutional Context, Integrating STEM, Teachers Use of Curriculum, Formative Assessment, Teaching Domain Specific Topics in the Common Core, Whole Class Discussion Framework (Lamberg, 2012) and Gestures. We are currently analyzing data and generating publications. A list of publications and presentations are available at http://www.nevadamathproject.com. This project is funded through the U.S Department of Education and awarded by the Nevada Department of Education.


Teruni Lamberg
Associate Professor of Mathematics Education
Welcome to the Nevada Mathematics Project. We love to hear your thoughts and ideas so that we can continue to build on this work. Project website: http://www.nevadamathproject.com
Couple of things to consider when watching this video
*What are some ways to build innovative partnerships?
*How can interdisciplinary teams work together to design professional development?
*What are some ways to integrate STEM disciplines to teach core content?
*How can research on learning sciences be integrated with content based professional development?
Amy Hackenberg
Hi Teruni:
I liked your video and love that you were working on the whole state of Nevada ;-). Also, the nanotechnology sounds really interesting--was that a hook to help teachers see ideas anew and together? Are you continuing with this avenue, or not? Also, can you say any more about how the groups at different sites interacted--was there a sense of unified purpose across sites, or was each site quite different?
Thanks! Amy
Teruni Lamberg
Associate Professor of Mathematics Education
Amy,
Thank you for liking our video. We took on a huge challenge trying to support the whole state. We had common goals across the four sites, but we used a design research approach to adapt the PD to the localized needs. What we discovered is that through each iteration the PD team became more effective in delivering the professional development. Even Though, we provided opportunities for teachers to interact across the state through social media sites, what we found is that teachers within each site communicated with each other and became a learning community. There were commonalities and differences within each site.
We used a project based learning approach to integrate the Nanotechnology. This provided a very engaging rich context for teachers to explore the mathematics and also think about stem integration and when it made sense to do so. Teachers loved the experience and learning. A series of papers and books have been developed from this project. The data analysis is still ongoing. Thank you for your comments.
Teruni
Robin Jones
Julie Amador
Teruni, Thanks for sharing your work! Those photos of Nevada definitely brought back memories! I am curious about the structure for the project, meaning the time the teachers spend in the professional development (e.g. Is it week-long institutes? How often?). Did you have any type of virtual aspect of it? It sounds like you drove A LOT! I am thinking about the rural aspects of Nevada compared with the rural aspects of Idaho and the similar challenges we may face. Thanks for the video! (Did I happen to see Zack in the video!?!)
Julie
Teruni Lamberg
Associate Professor of Mathematics Education
Julie, we miss you in Nevada and you were part of the Northeastern Nevada Math Project. This project, we had week long institutes with 3 follow up sessions for each site. Yes, we did drive a lot. The face to face experience is valuable for understanding the unique needs of the region. (We had 4 sites). There is power in personal relationships. Teachers also drove to attend each site. Not all teachers within each site get to see each other physically, so it built a regional learning communities. We had some virtual assignments and resources for them to do. But there is no substitution for the relationships that we built face to face. Also, the project team became a learning community. When you work together for 4 weeks straight, you learn from each other as well and evolve as a team. This type of work is very labor intensive. But the impact the prior project that you were part of is profound. Many of the teacher from the Northeastern Nevada Mathematics project are in leadership roles across the state. This positions us to create better. And, yes, you did see Zack! :)
Julie Amador
I was thinking it was the same project! Great work and thanks for the explanation and details about the project. I agree that the type of work you are doing is very time and labor intensive. And so happy to see Zack!!
Teruni Lamberg
Associate Professor of Mathematics Education
This is a new project that built on the previous project. In this project, we did the whole state. We had 4 locations in Elko, Silver Springs, Las Vegas and Reno to give teachers from the entire state access. We also had local regional teams that provided support to each location. I think the online work that you are doing is interesting and will be helpful for us to think about supporting teachers in the follow ups. I look forward to chatting with you more about some design features.
Feng Liu
Researcher
Thanks for sharing this interesting work! I totally understood the challenge of delivering the PD and collecting data state wide. I would like to know more about how you measure (or going to measure) the impact. As you mentioned, this initiative has impacted over 12, 600 students. Could you share more on how you measured the impact? What type of data did you collect to measure the impact?
Teruni Lamberg
Associate Professor of Mathematics Education
We collected data on the following topics and the analysis is ongoing.
http://nevadamathproject.com/research-project/
Our focus on data collection was primarily focused on the teacher. Specifically, we collected pre and post teacher content test data, levels of implementation of the Whole Class Discussion Framework, Journals of teachers use of formative assessment, and Curriculum. We video taped all PD sessions and collected field notes. Mitchell Nathan and Rebecca Boncoddo were part of an IES grant and they collected data on teachers use of gesture in instruction.
We collected data on how many students were taught by the project teachers. However, we did not specifically measure student achievement data due to scale and budget.
Gerad OShea
Research Director
Thanks for sharing this work! I'm really interested in the inclusion of gestures here. Is there research on the specific role of gesture in supporting science and math learning? Can you share any details about the data that was collected on gesture use as part of the evaluation?
Thanks,
Gerad
Teruni Lamberg
Associate Professor of Mathematics Education
I will have Mitchell Nathan respond to your question. Yes, there is research in this area and it supports STEM learning.
Kristana Textor
Hi Teruni-
I really enjoyed how you started your video with the story of a 19,000-mile journey - what a fun graphic you had with the map! What program did you use to make it?
I work with Julie on the SyncOn project and had similar questions about your virtual components. How were the virtual assignments structured, and what tools did you use to coordinate this? Were the virtual assignments a part of your data collection, and could you tell us a bit more about them? We are collecting artifacts from participants (via google drive/doc/and draw) and would love to hear any tips you might have about collecting, organizing, and accessing participant work. Oh and PS I am impressed with the still photos you included, it looks like you had a LOT of documentation to draw from for the video!
-Kristana
Teruni Lamberg
Associate Professor of Mathematics Education
Kristana,
The virtual assignments consisted of tasks from the project website such as sample student tests to administer based on the Common Core Standards and also the PDToolkit from the Whole Class Mathematics Discussions book along with the book. The PD Toolkit contained videos, downloadable worksheets, powerpoints etc. (A new version will be available this September form Rowman and Littlefield titled Work Smarter, Not Harder: A Framework for Math Teaching and Learning. A blog http://www.mathdiscussions.wordpress.com was also created as a resource for teachers to use.
We structured our virtual assignments where teachers formed collaborative teams within the PD. These groups formed based on grade level needs and communicated with each other on the lessons they planned during the PD sessions. The teachers set the agenda during the PD sessions as what was meaningful and relevant for them personally to work on in their classrooms based on what was discussed in the PD sessions. We did this because we had multiple grade levels in our sessions.
We let the teams to decide what would be the best format to communicate. The goal was to support professional learning communities in a meaningful way and we provided resources and support. We had local organizing teams formed with district leaders who provided support at the local level such as coaching feedback or additional support.
We found that accessibility to technology across the state was not consistent. Some districts had firewalls that prevented outside links to work. Therefore, many teachers relied on their own personnel technology at home. Some teachers were very comfortable using technology others were not. I would love to learn more about how you used technology. What platforms did you use?
We used powerdirector 17 to create the graphic :) I look forward to learning more about your project.
Teruni
Teruni Lamberg
Associate Professor of Mathematics Education
Here is the framework that was integrated into the professional development. Teachers worked on different aspects of the framework to refine their teaching during the academic year. This framework became a basis for the follow up sessions. It was integrated into the professional development design during the summer institutes.
https://mathdiscussions.wordpress.com/whole-class-discussion-framework-checklist/
The virtual tools were designed around the framework that included videos, worksheets, study guide etc. The teachers formed learning teams and worked on aspects of the framework to help refine their teaching.
Nancy McGowan
Instructional Math Coach
Very interesting work! What was the time frame for the professional development as well as the length of time between the teacher pre and post test. How did integrating gestures from the learning sciences impact student understanding? Did you have some individuals to use math practices with gestures and some without to determine the impact?
Thanks for your hard work!
Teruni Lamberg
Associate Professor of Mathematics Education
Nancy,
Thank you for your comments and questions. The timeframe for the pre and post content test were during the week long summer institute. Three surveys were conducted on teachers use of gestures at the beginning of the week, the end of the week and the end of the follow up sessions. Research on use of gestures was explicitly integrated into the PD along with the whole class mathematics discussions framework.
Teruni
Teruni
Further posting is closed as the showcase has ended.