NSF Awards: 1621289
Zoom In, a new online curriculum platform, is designed to develop students’ evidence-based thinking, data analysis and writing skills as they examine important questions related to key earth science and biology concepts. Aligned to the NGSS, the digital curriculum modules use an inquiry-based approach in which students work dynamically with authentic data sets and learn to use the data as evidence to answer questions about topics like earthquakes, climate, exoplanets, and evolution. The tool scaffolds students as they read, interpret, and actively manipulate data sets, and also as they use the results of their data analyses to build and write evidence-supported arguments. The modules also include supports for teachers to launch, guide, assess, and respond to student work. The presentation will provide some examples of the modules and share some lessons learned about incorporating data literacy skills and concepts in the context of regular science instruction, based on pilot testing this tool with teachers and students.


David Campbell
Program Officer (retired)
This is a timely and important project. I was just curious if you spend any time discussing how the data is collected in the first place, or if students are taught to critically analyze data (e.g. outliers, etc.)
Brooks Mitchell
Megan Silander
Research Scientist
Thank you for your question David. Each of the modules we developed includes a "data orientation" section where students identify and discuss the sources of the data. Some of the modules go into more depth about the process for collecting the data, particularly when the process is complex (e.g. at the beginning of our module on exoplanets).
Brooks Mitchell
Bill Tally
Senior Research Scientist
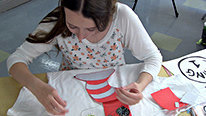
Hello and thank you for visiting the Zoom In! Learning Science with Data project! We're a collaboration between EDC and the Concord Consortium, and our goal is to help high school science teachers integrate inquiry with authentic data sets into their regular science courses, as a means of building students' fluency with data of all kinds. We're now studying how teachers use our three data-rich Earth Science modules in science classrooms around the country (the video highlights one NJ classroom). Helping students manipulate, analyze and write about real and complex data sets in their science classes is important — and challenging! We'd love to hear from teachers, researchers and data scientists about what questions and needs you have — and what works for you! Please join the conversation...
Katie Stofer
Hi Bill, how are you supporting teachers in integrating these into already packed curricula?
Also, how highly curated are the data - the student seems to be convinced about climate change, but some of the most sophisticated misinformation campaigns use the data to make specious interpretations - are you introducing the students to any of that?
Salvador Huitzilopochtli
Bill Tally
Senior Research Scientist
Great questions Katie, thank you for them.
First, you're right about the 'already packed curriculum' problem. Recognizing this, we're doing three things. First, we're tackling topics that are prominent in the standard curriculum - evolution in biology, plate tectonics in earth science, etc.; second we're providing support for something that teachers say they need help with — writing about the data (claims/evidence/reasoning); third, we're trying our best to keep the modules reasonably short (that said, we recognize many teachers will NOT have time for a data-rich investigation that take 3-4 class sessions.)
Second, the question of how we combat misinformation and propagandistic, perhaps specious uses of data is acute. It likely needs to be confronted directly, through teaching about common uses of data to mislead and distort, as well as indirectly (as we are here) by building students' skills in working directly with real data, seeing themselves how it can be made to say different things in all kinds of ways; essentially helping students learn to both value and question the "data moves" through which we are increasingly apprehending the world.
Brooks Mitchell
Kathryn Kozak
My grant, StatPREP, is working to teach introductory statistics teachers in the first two-years of college to teach statistics from a data centric point of view. It is great to think that students that are coming out of K-12 are exposed to real data and then using that data to answer questions. Are you using these techniques in all of your science courses? If you have, do you see students who take other science classes asking critical questions about the data? If you aren't, do you find that students in classes not using these techniques are asking to see the data behind the science?
Megan Silander
Research Scientist
Thank you for your interest! Right now we are piloting the earth science data modules with a small sample of 12 teachers, and just beginning to take a look at evidence of student learning after using the module. Whether they can transfer these skills to other contexts is an interesting question--one that we would love to explore in future studies. Is this something you have seen in your work?
Sharon Hessney
Are you familiar with "What's Going On In This Graph?" A partnership of the New York Times and the American Statistical Association, it presents a broad variety of engaging graphs and asks students to explain what they notice and wonder. Released weekly during the school year (and saved in the archive), students can discuss their claims and evidence with classmates and online with students around the world and teacher moderators.
There is also a teacher resource Teach About Climate Change with These 24 New York Times Graphs. A webinar explains how to use the graphs from the perspective of the editors, teachers, and students.
I think you and your students will find a broad range of topics (including science) displayed with a broad range of types of graphs that will keep your students thinking about their insights after you have moved on in class.
Sharon Hessney (hessneymath@gmail.com)
Megan Silander
John Parris
Kathryn Kozak
Karin Lohwasser
Thank you Sharon for the links! I didn't know about these resources....
Cristián Rizzi
Congrats for this great initiative! I'm a big fan of CODAP and all the Concord Consortium projects. I personally translated CODAP into Spanish and always looking for educational resources to translate & adapt to bring them into Spanish speaking classes in Argentina and other parts of the world.
I wonder how we can access the Zoom In! curriculum modules.
Thanks a lot. Kind regards,
Megan Silander
Research Scientist
Thanks Cristian--it would be great to hear more about your experience with CODAP and ideas for how Zoom In might be relevant. I'll follow-up with you directly.
Molly Phillips
This project is highly relevant to two projects I work with --- iDigBio (Integrated Digitized BioCollections) and BLUE (Biodiversity Literacy in Undergraduate Education)! We would love to learn more about how we could work together. Maybe collaborate on a module? Or at least link to your resources related to biodiversity from our project pages. So glad we learned about this! Let me know if you are looking for new collaborations!
Mary Murphy
Instructor
I am very interested in knowing how you will give others access. Will this be in the concord consortium resources? Wondering about how this might be scaled up. I am also wondering if students can load their own data into the platform? We have several long term monitoring projects that it would be great to explore in this type of platform.
Karin Lohwasser
Karin Lohwasser
I am having the same questions. When and how will these resources be available? This is exactly the area teachers are struggling with finding accessible and reliable sources. Thank you Zoom In! team.
Megan Silander
Research Scientist
Hi Mary and Karin - thank you for your interest in using these modules. Right now we are still in the piloting stage of developing the modules and associated teacher supports, so the modules are not yet available public use. Once we finish the piloting, we plan to make some more changes to the platform and modules and then make available for public use, probably next spring. If you are interested in participating in the study, please let me know!
To answer your second question, Mary, right now students are not able to load their own data into the platform.
Jacob Grohs
Assistant Professor
Thanks for sharing! Can you talk more about the communicating your interpretation and supporting that claim with evidence writing component? It looked very interesting (students were typing into a box on the screen during the video) and had me thinking about how the structured focus on communicating and supporting a claim is in and of itself its own significant objective. I'm wondering if there are elements of the activities students are more or less motivated for? Or elements of the activities that teachers feel more or less prepared to facilitate?
Abigail Levy
Great work, ZoomIn Team! Have you thought about whether/how this approach, tools, and/or datasets could be adapted for younger grades? What do you think is possible and what would be the up- and down-sides?
Thanks for this contribution!
Abigail
Randy Kochevar
That's a great question, Abigail! We are fortunate in that as we are developing the ZiSci project, we have also been working on lessons aimed at middle schoolers for National Geographic, as well as working with the Gulf of Maine Research Institute on data-focused curriculum modules for 5th and 6th graders around the topic of climate change. There has been a great deal of cross-pollination among all three projects, particularly around data analysis and visualization tools (Concord Consortium's CODAP tool is common across all three projects), and the use of the claims/evidence/reasoning model. The very rigorous focus on a scaffolded writing task, central to the ZoomIn! learning platform, has helped shape our thinking on how to support younger students in constructing an argument using data as evidence.
With that said, there are things we've needed to keep in mind as we work with younger students. For instance, there is an important transition that happens between 5th and 6th grade, where students shift from thinking about individual data points (e.g., plotting points on a graph) to thinking about data in aggregate (e.g., plotting a trend line through a dataset in a scatter plot). And for some kids, a scatterplot alone may represent a new and unfamiliar way of looking at data!
As we pilot these new materials with students and teachers, we are looking carefully at what data skills are relevant and appropriate for our target grade levels. We are also reminded that effective facilitation is critical, and that data-driven, inquiry-based learning may be new territory for many teachers. This underlines the need for good professional development and ongoing educator support.
Amy Bolton
Great project! I am interested in how you curate the data sets. How much data? How complex is the data? And how much content support do you need to offer the students in order for them to use authentic data?
Amy
Megan Silander
Research Scientist
Great questions Amy, and ones that we are still grappling with as we develop the modules. The data are relatively curated and align tightly to the inquiry, for the most part. The complexity of the data varies depending on the module in terms of number of variables that students can use, as does the content support. Our largest dataset within a module so far is about 9,000 cases, with about 13 variables.
Balancing scaffolding of content knowledge, data and math skills and knowledge and how to use the tools themselves has been a challenge throughout development. The implementation study, which we are in the process of conducting, is taking a closer look at how much content knowledge students seem to need to engage in the modules, and the extent to which teachers are supporting content knowledge outside of the modules as well, which should inform the next iteration of each module.
A Daniel Johnson
Have you considered "not" having carefully curated and selected data, and giving students access to some open-ended, messy big data sources? I'm curious whether students would get frustrated, or would dig in because they want to know?
Megan Silander
Research Scientist
Your questions hits at one of the biggest struggles we faced in developing the modules - how to scaffold students' experiences while also encouraging student-directed exploration of the data. In our initial testing, the modules did not include much scaffolding and we found that students and teachers got frustrated, as you suggest. Understanding how to use the data analysis platform, the science content, and the data skills and math was overwhelming--as a result, we added in more scaffolds to the platform and suggestions for supports the teacher should provide. I think it is possible to provide students with a more open-ended experience but that this would have to follow the more scaffolded one. This question is something we would like to work on in future research.
Mary Murphy
Instructor
I have been working with data sets using the TUVAlabs tool. It is a great tool for being able to manipulate numerical data in many different ways and it has been a much needed tool in my toolkit. It seemed like Zoom integrates visual data (GIS data?) and numerical data? Is this true? That would be very interesting. Also, does this work on an iPad platform?
Megan Silander
Research Scientist
Yes, the modules include visual displays of the data including tables, maps and graphs (which are connected--highlighting a row in a table highlights a point in a graph and a map when displayed together), and both numerical and categorical data. It does not work well on an iPad platform, however.
Rachel Connolly
Interesting project, and I appreciate the complexity of balancing usability in the classroom context with learning goals. My question is about the types/formats of data you are considering for these experiences, and if they go beyond quantitative data sets that are plotted/graphically analyzed to also include geographic data and maps or imagery (satellite images) and even simulations?
Further posting is closed as the showcase has ended.